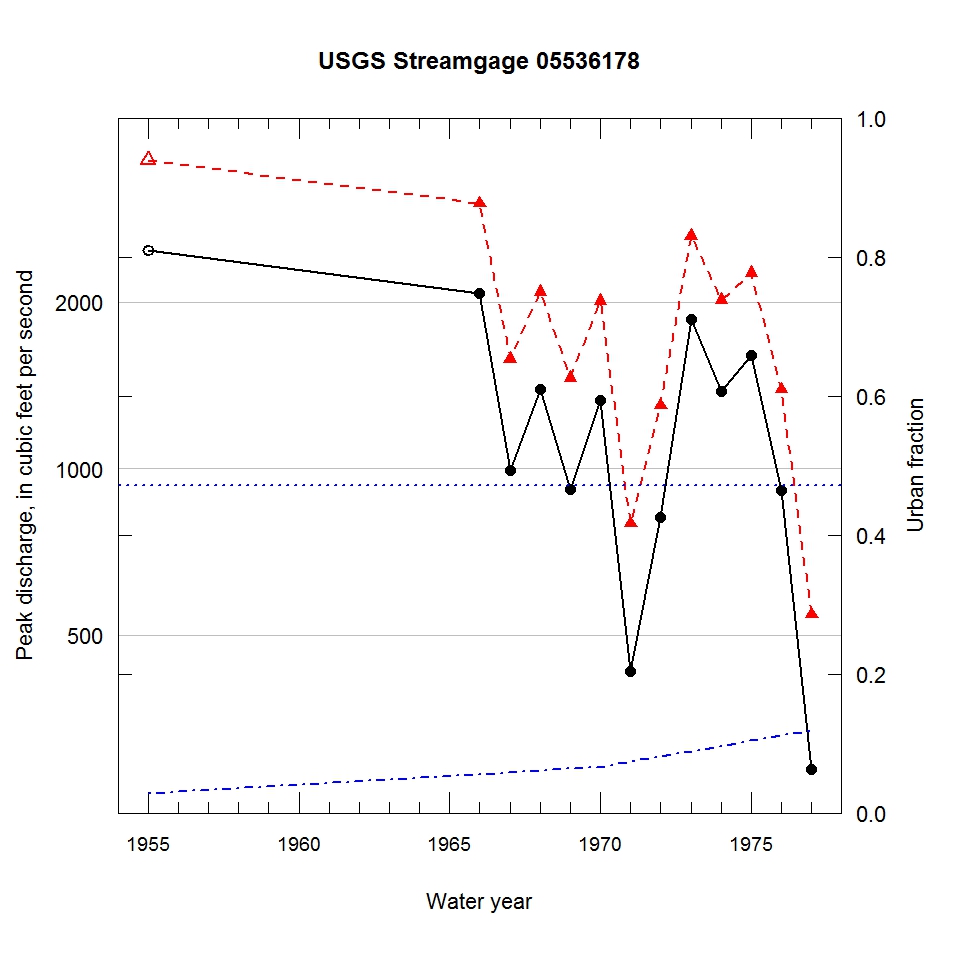
Observed and urbanization-adjusted annual maximum peak discharge and associated urban fraction and precipitation values at USGS streamgage:
05536178 PLUM CREEK NEAR DYER, IN


| Water year | Segment | Discharge code | Cumulative reservoir storage (acre-feet) | Urban fraction | Precipitation (inches) | Observed peak discharge (ft3/s) | Adjusted peak discharge (ft3/s) | Exceedance probability |
| 1955 | 1 | 7 | 0 | 0.028 | 3.370 | 2480 | 3620 | 0.053 |
| 1966 | 1 | -- | 0 | 0.056 | 1.515 | 2080 | 3020 | 0.093 |
| 1967 | 1 | -- | 0 | 0.059 | 1.177 | 991 | 1580 | 0.509 |
| 1968 | 1 | -- | 0 | 0.061 | 1.580 | 1390 | 2090 | 0.284 |
| 1969 | 1 | -- | 0 | 0.064 | 0.496 | 916 | 1460 | 0.574 |
| 1970 | 1 | -- | 0 | 0.066 | 1.490 | 1330 | 2010 | 0.315 |
| 1971 | 1 | -- | 0 | 0.074 | 0.973 | 430 | 796 | 0.896 |
| 1972 | 1 | -- | 0 | 0.081 | 1.265 | 816 | 1300 | 0.658 |
| 1973 | 1 | -- | 0 | 0.089 | 0.920 | 1860 | 2640 | 0.147 |
| 1974 | 1 | -- | 0 | 0.096 | 0.983 | 1380 | 2020 | 0.310 |
| 1975 | 1 | -- | 0 | 0.104 | 1.339 | 1600 | 2260 | 0.222 |
| 1976 | 1 | -- | 0 | 0.111 | 1.567 | 914 | 1390 | 0.613 |
| 1977 | 1 | -- | 0 | 0.119 | 0.722 | 285 | 545 | 0.957 |

